GTI – Features/Screenshots
This site should present you some features of the developed application. The front-end is written in C# and retrieves data from the Oracle database and/or the python server (see: GTI architecture). The latter run both under GNU/Linux. For the client/server connection, Thrift was selected instead of protobuf mainly because of the availability of C# bindings and a richer data structure. Since the transported data is meant to be presented to the human eye, the mentioned protocol is fast enough. All speed-relevant applications may be written on the GNU/Linux server side in Python/Cython/Numba/Cuda/C++/C. C# was chosen solely to allow a rapid development of ergonomic and user-friendly GUIs.
A fast overview of the application is given by the following three screenshots that show the execution, historical data charting and search views. The order and execution-report messaging is done over multiple operating systems (using different programming languages) and is FIX compliant. The trading system server (running on Linux) contains an order matcher module that realistically simulates order executions on the appropriate instrument order book.
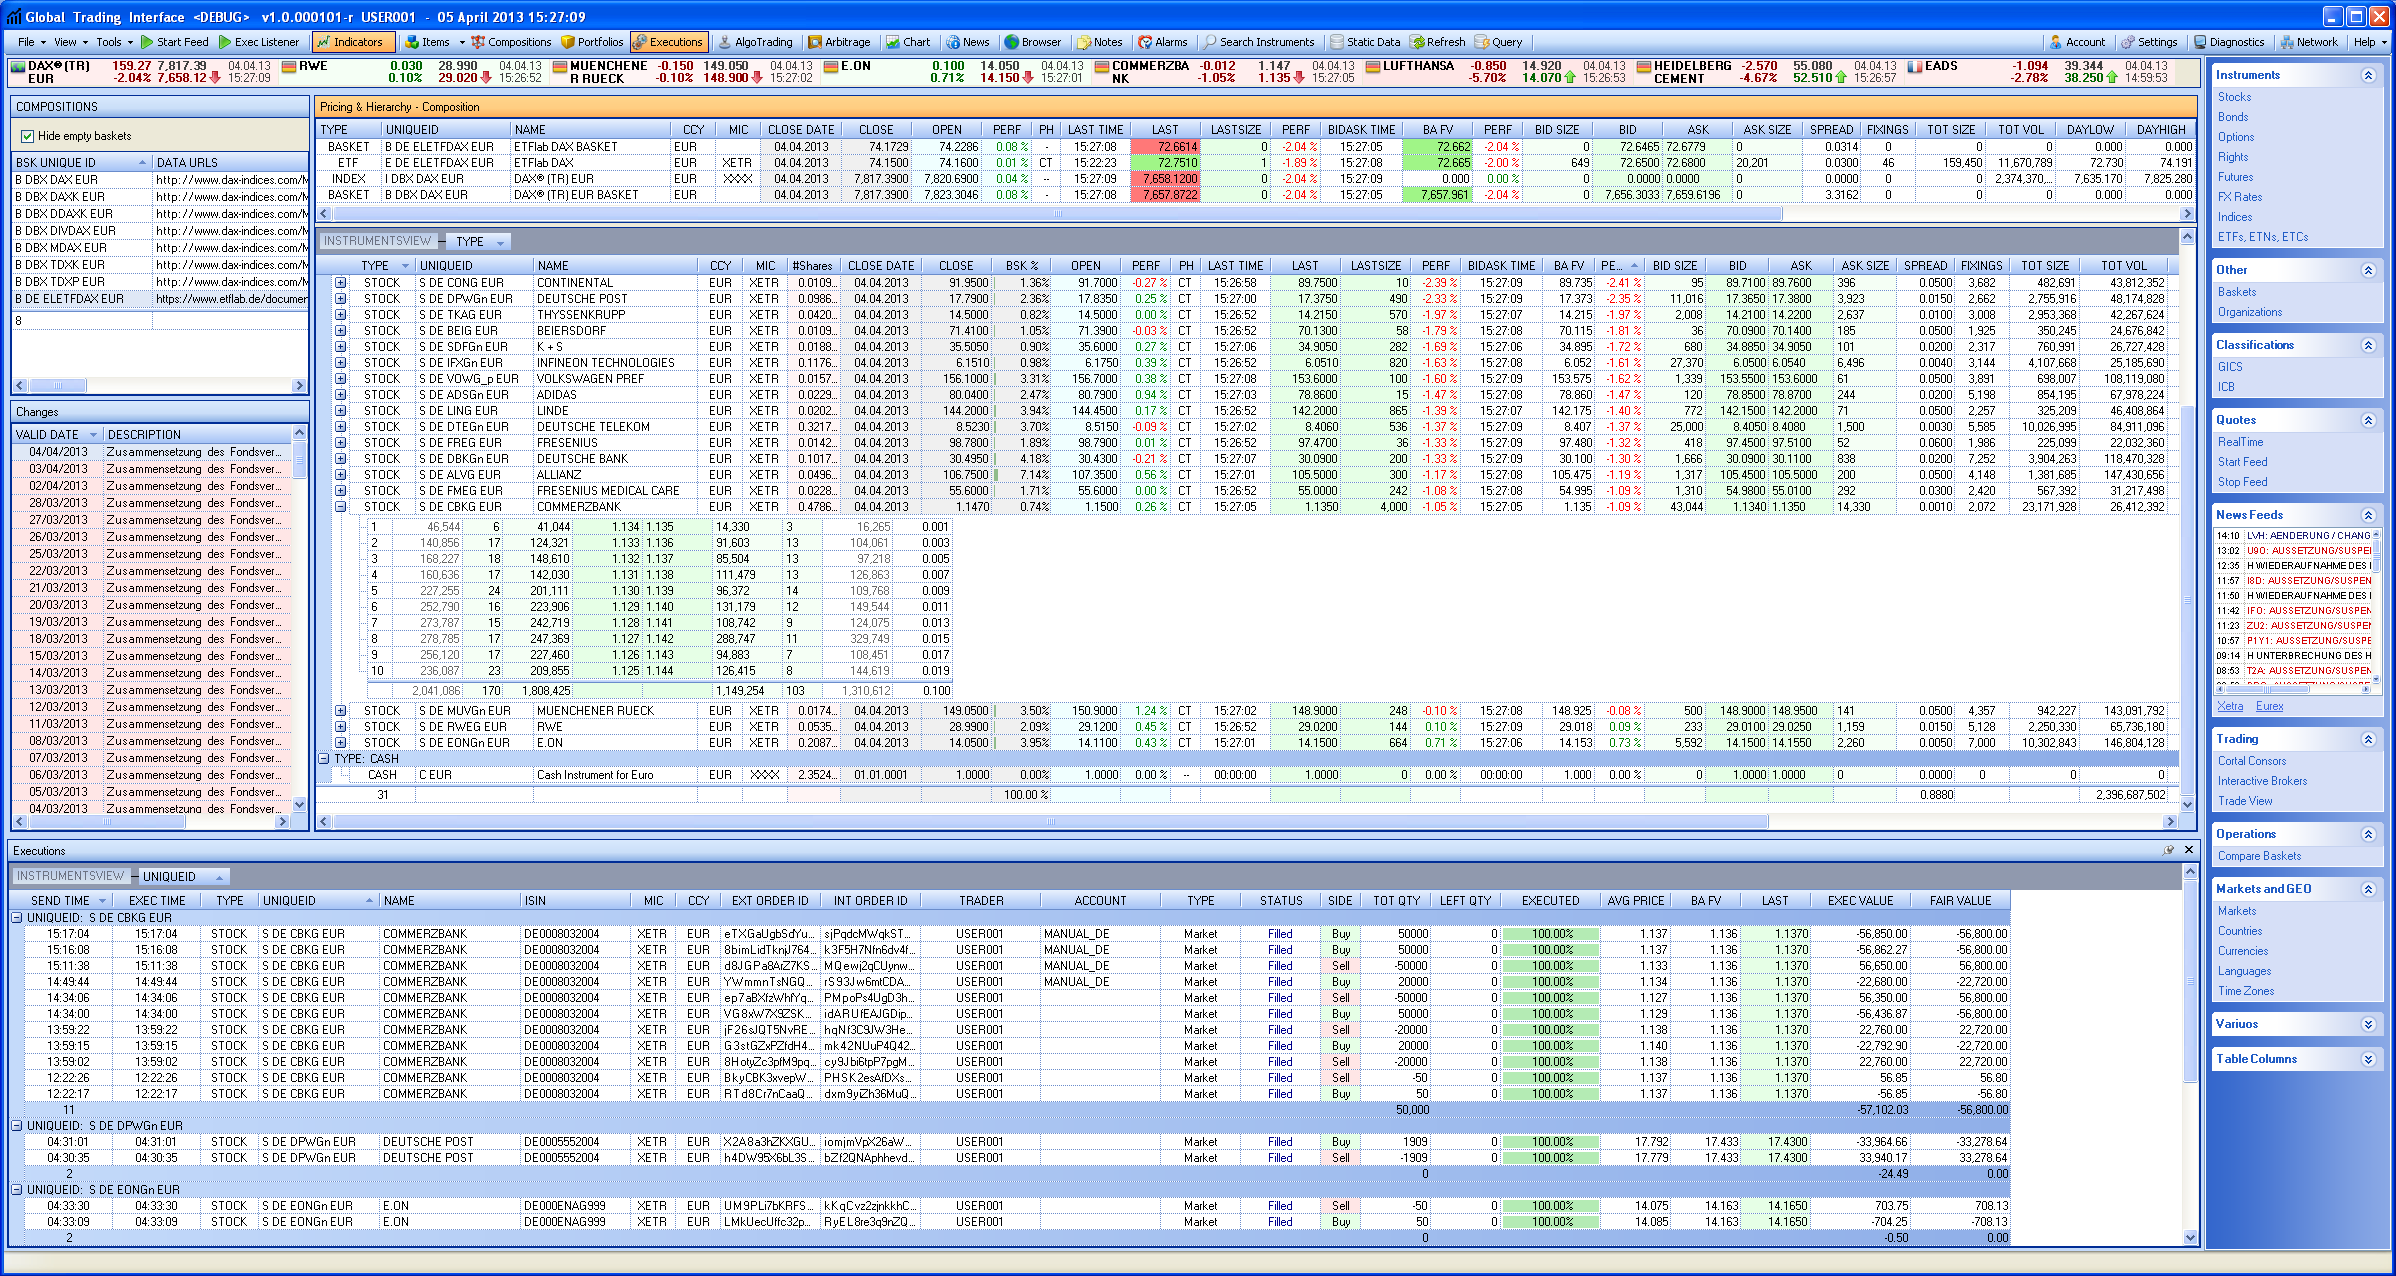
Executions View
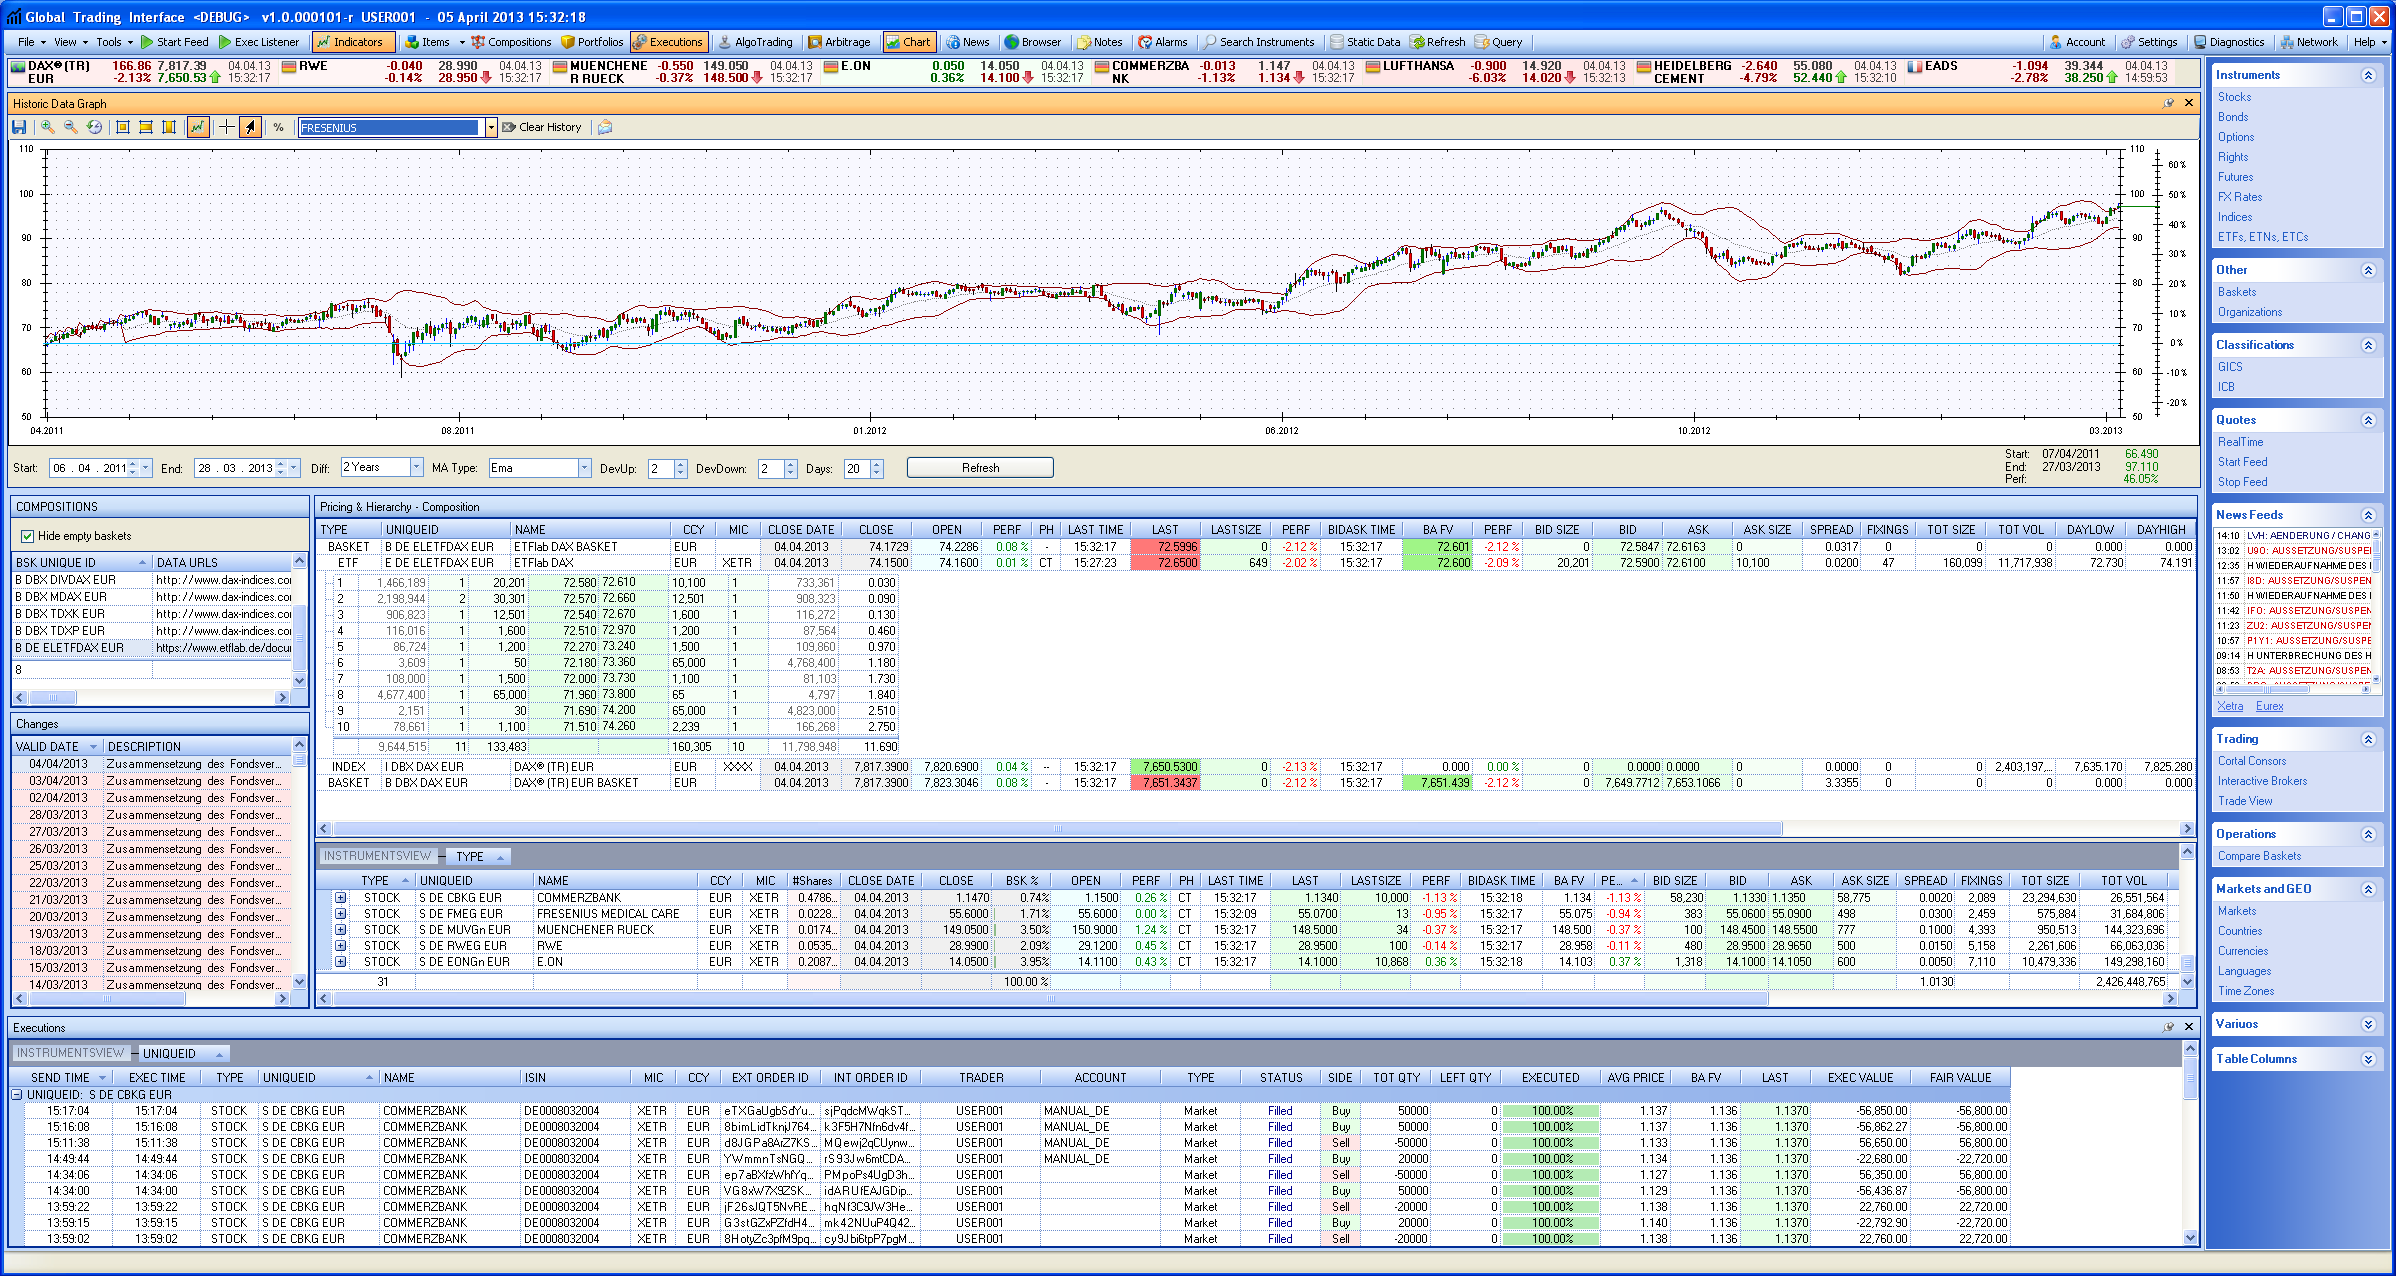
History Chart
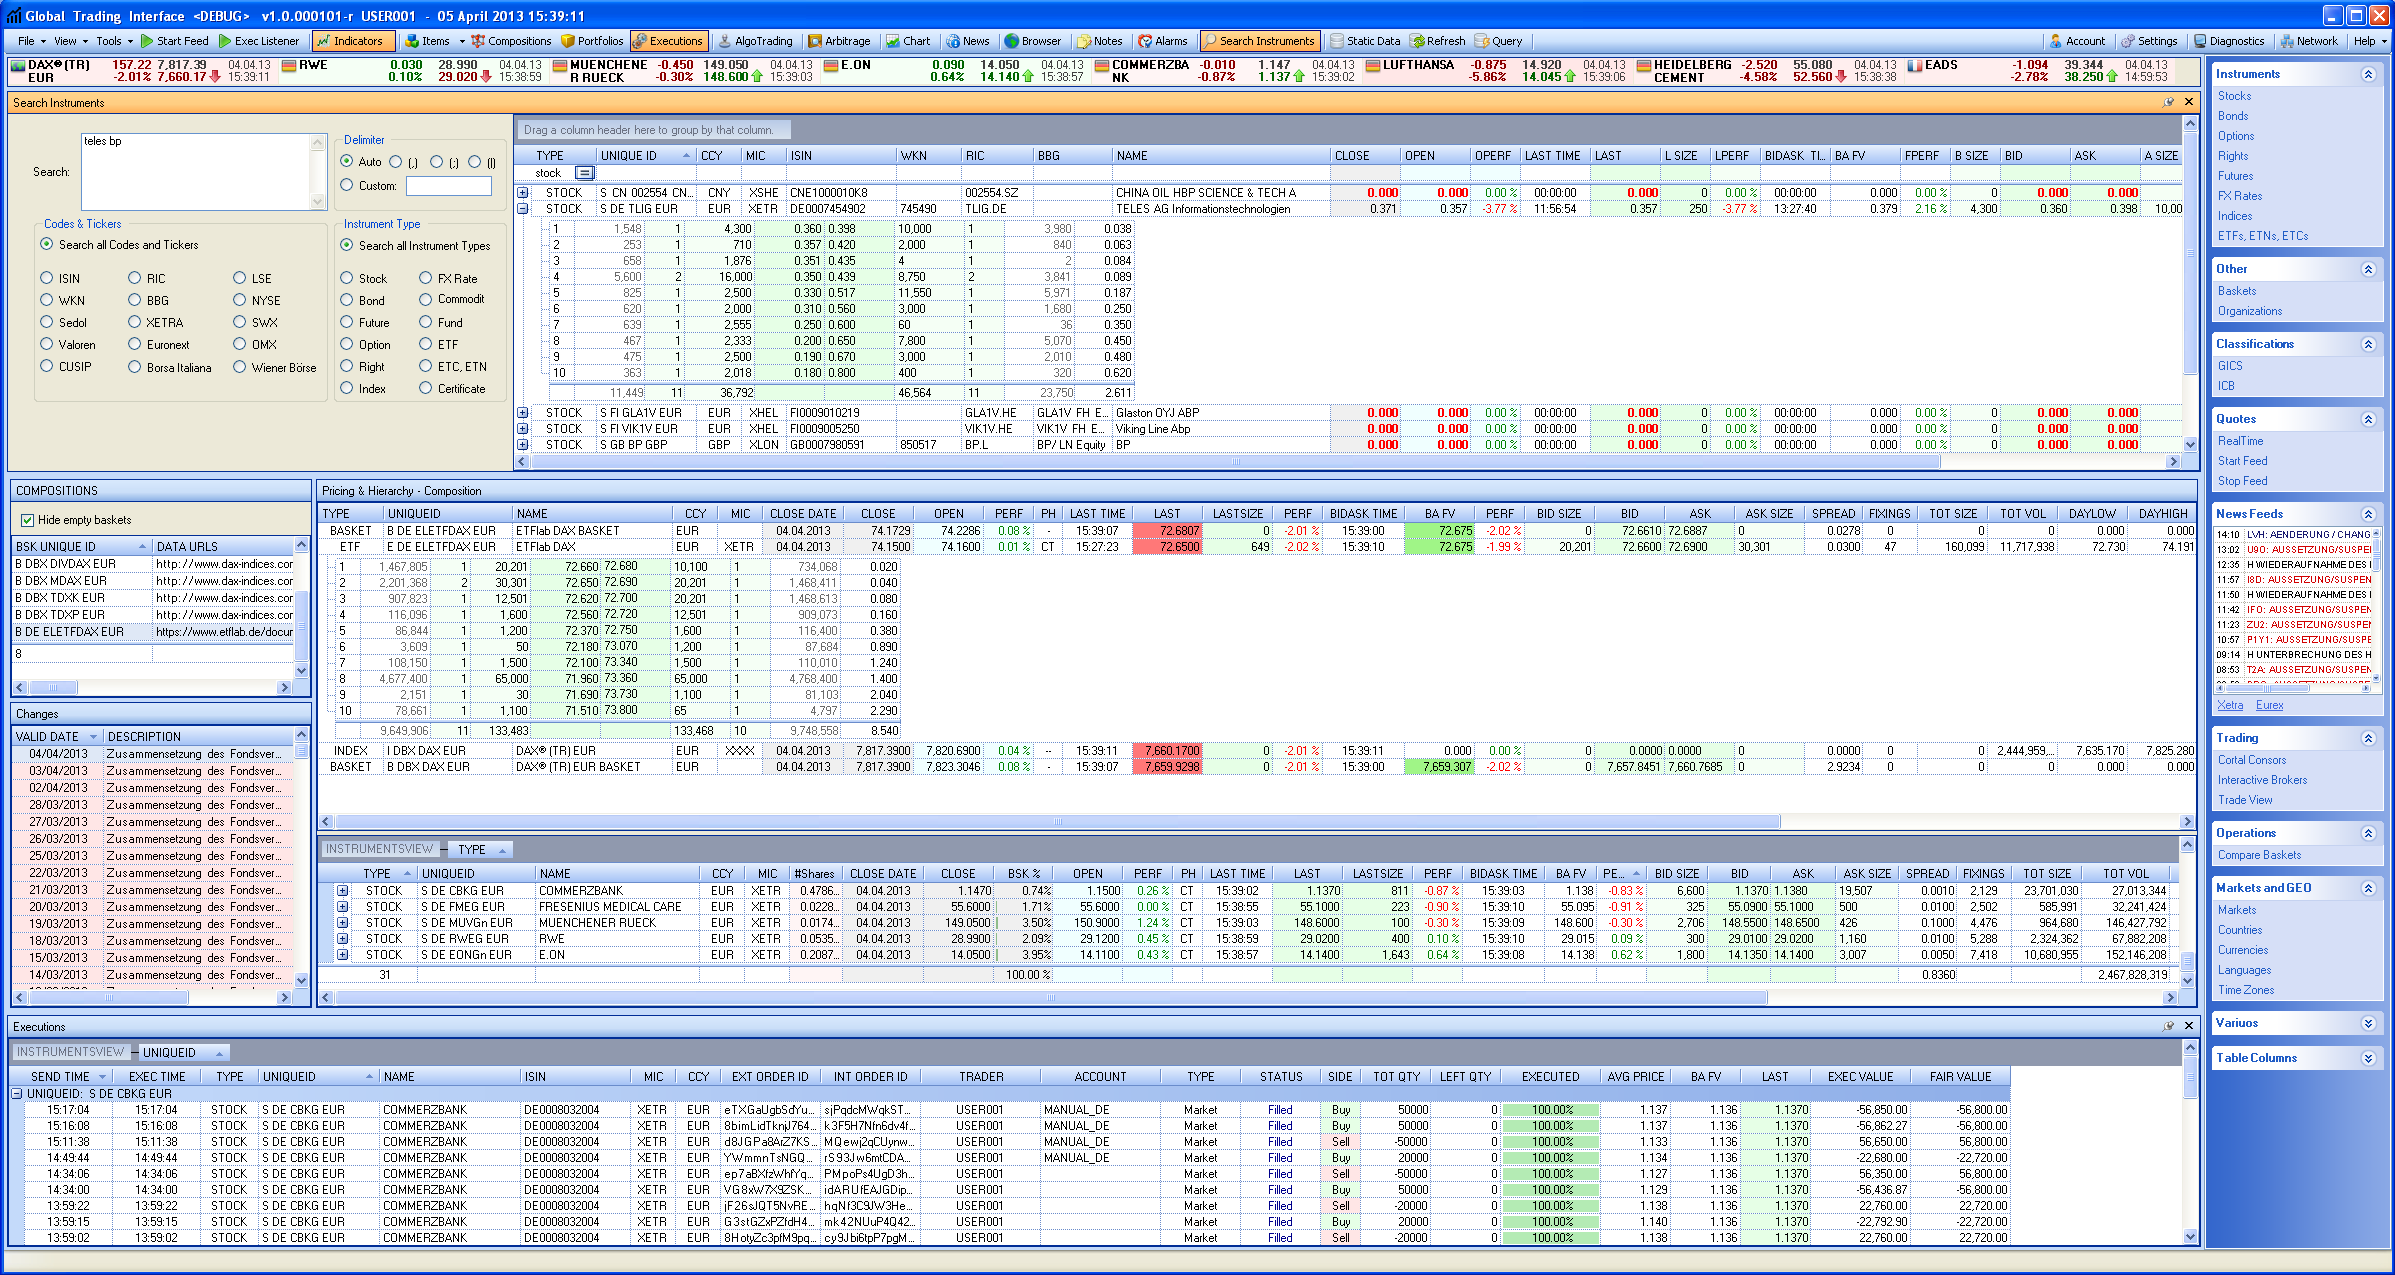
Instrument search form
The PyXLL add-in in conjunction with a custom python module allows to access database data and server services in Excel.
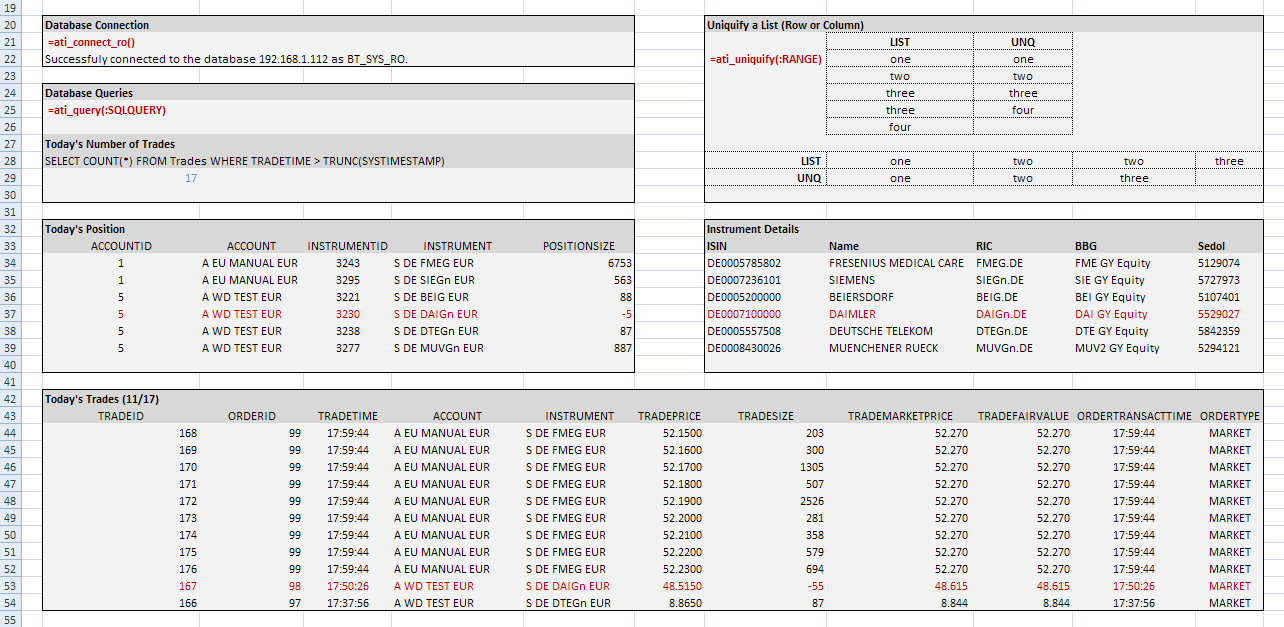
ATI Excel Addin
Market phases that differ from “Continuous Trading” (eg. “Intraday Auction” due to volatility interruptions or “End of Trading”) are highlighted. The example below shows three stocks that are still in the midday “Intraday Closing Auction” phase.
Trading phases highlighting
The next screenshot shows the stock universe view where the stocks are sorted by name, then filtered by country (DE) and ICB (not empty). The upper left corner shows that new columns (e.g. VALOREN) may be added if needed.

Stocks View
As long as an asset is linked to an ICB (or GICS) code, it can be displayed as part of its specific classifications. The following screenshot shows a selection of stocks that can be found in Banking, Insurances or Financial Services industries and is quoted on XETRA (MIC Code=XETR). The market data to be shown can be personalized, double clicking on the stock will show you the real-time orderbook with the available depth.

ICB Stock Selection
Another way to make a preview over an asset group with a few clicks is to start from the market or countries view. The following screenshot shows all Italian (IT) markets available in Milan (mi*). Most people will be interested in the Electronic Share Market MTAA (Reuters identifier: .MI, Bloomberg ID: IM).

Markets View
The country view also contributes to increase the wide range of queries that can be made on the asset universe. Only a few examples:
- The stocks of which sectors are performing best in Brazil and it’s direct neighbours?
- What markets are available in Indonesia and their neighbours (e.g. neighbours depth 2 = neighbours of neighbours)
The same kind of queries could be made on a more detailed geographical level, e.g. cities (population, area, etc.). Having a good standardized source of economical indicators and linking these with geographical data allows much more interesting queries.

Countries View
The time zone table is used in the system to calculate the own local time for markets all around the world.

Timezones
The next image highlights the ETX view after XETRA closing. The view is filtered by Family (etflab), grouped by category (in this case Equity and Fixed Income) and sorted ascending by last/close performance. Double clicking the instrument displays the order book, which in this case shows the result of the closing auction. Other columns show market data (open/close values, performance, etc.) and static data (fee, TER, replication method, spread, minimum quotation unit, etc.).

ETF view after Xetra closing
The basket pricing view shows the compostion and pricing details of a product (e.g. index, certificate, etx, custom portfolio, etc.) as well as its components. The composition below is grouped by instrument type and sorted by instrument performance. Double clicking a product or an instrument shows as usual the related orderbook. Real-time prices and basket calculations are streamed from the python server running on GNU/Linux. A C# price/data provider interface enables the inclusion of Reuters/Bloomberg data streams into the application. In the examplary screenshot, not only the product (ETFlab DAX) market/static data is shown but also the data of the related Index, the Deutsche Börse DAX (TR) EUR (compositions available here and here).

Basket Pricing View
Through the basket comparison view it’s possible to highlight the impact of composition changes (reshufflings, corporate actions, etc.) in an easy and intuitive way.

Basket Comparison
A news feed preview is available on the right side of the application. The news are highlighted by their impact on the underlying (dividend payment, capital adjustment, trade suspension, trade restart, etc.).

News Preview
The news window shows the information of the selected RSS channel and highlights automatically the affected instruments that are found in the database. Selecting multiple news titles allows the announcements and the affected instrument groups to be merged.

News Feed
Every context menu on an instrument allows to edit the instrument properties. The edit form forces the entered values to match both data source and custom constraints. In the second example, the instrument name is matched against the regular expression
"^[a-zA-Z0-9 _!\"§$%&/()=?+#]*$". The form group-boxes are added dynamically depending on the instrument type to be shown.
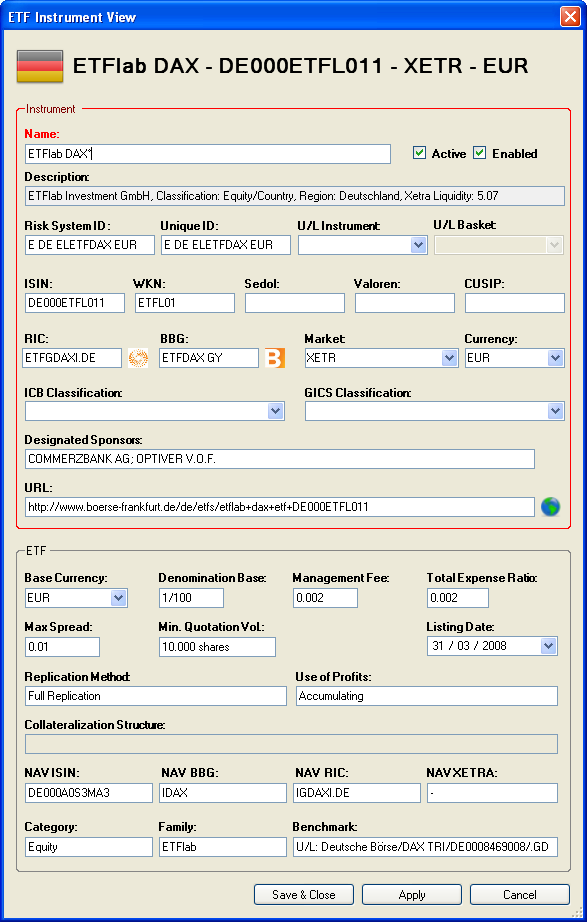
Instrument/ETF Edit Form - Data validation
Below an example how the Oracle database data may be displayed. Here another example showing that data may be transferred and displayed independently from operating system and application (Web Browser/Excel/C# Application, etc.) used.

Dax Instruments History
A simple default order view gives a short market view for the product to be traded.

GTI - Single Order View
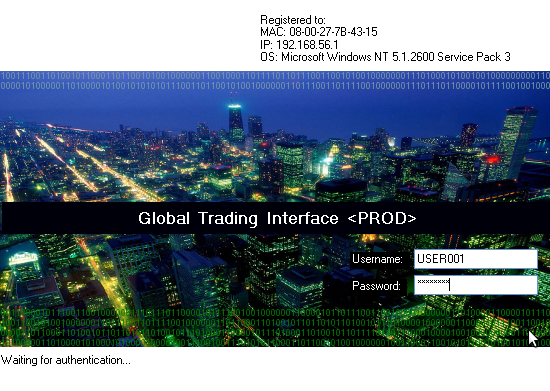
Splash Screen
If you have any questions/comments/complaints regarding this application, feel free to drop an email at
![]()