The Trading System
The single security trading system presented here is also referred to as an agent trading on a single data series. The decision function of the agent is modeled with a recurrent neural network. The weights of the network are optimized using a direct reinforcement learning technique. Various ratios are used as contribution to the on-line optimization of the internal system parameters. It can be chosen if the ratio should distinguish between upside and downside risk or not.
At the time an agent can take three positions, namely long, hold (or neutral) and short. As a result following strategies can be used:
- default: long-hold-short positions
- active: long-short positions
- conservative: long-hold positions
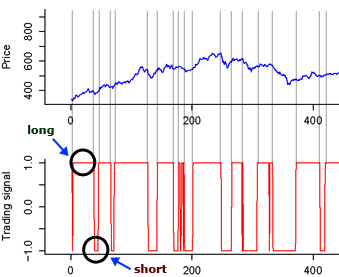
An example output of the trading system is presented in the next figure which shows an agent with a long-short strategy trading on the TecDax. The agent learns from scratch and is able to show a considerable performance already in the first 400 Periods.
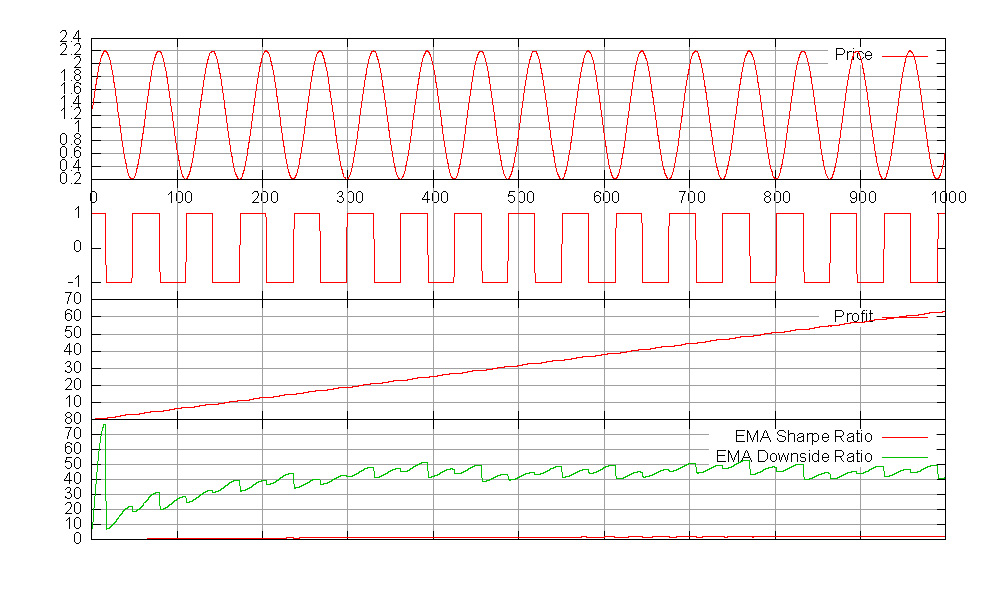
To prove the agent’s ability to find a strategy on a series with a single pattern, he is confronted with a slightly modified sinus function. The agent finds soon its strategy and is able to shortchange the predictable slope of the sinus function and maximize his profit. The simulation result is presented in the next figure.
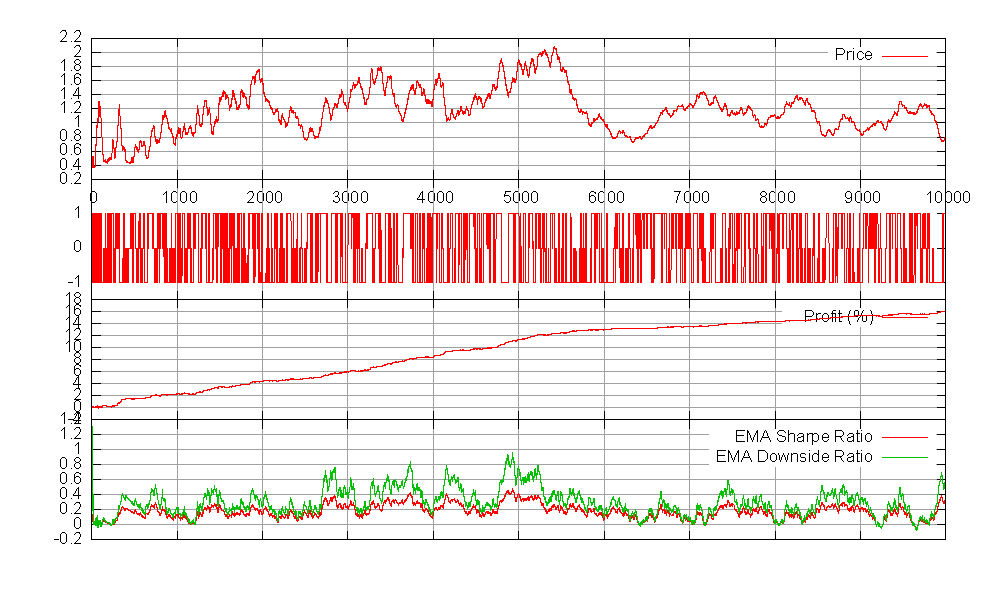
The next figure was automatically generated by the trading system and shows the behavior of an agent which traded on an artificial data series of 10,000 periods. The agent used the default strategy and the default system parameters. Tuning the system parameters resulted in a considerable improvement in performance.
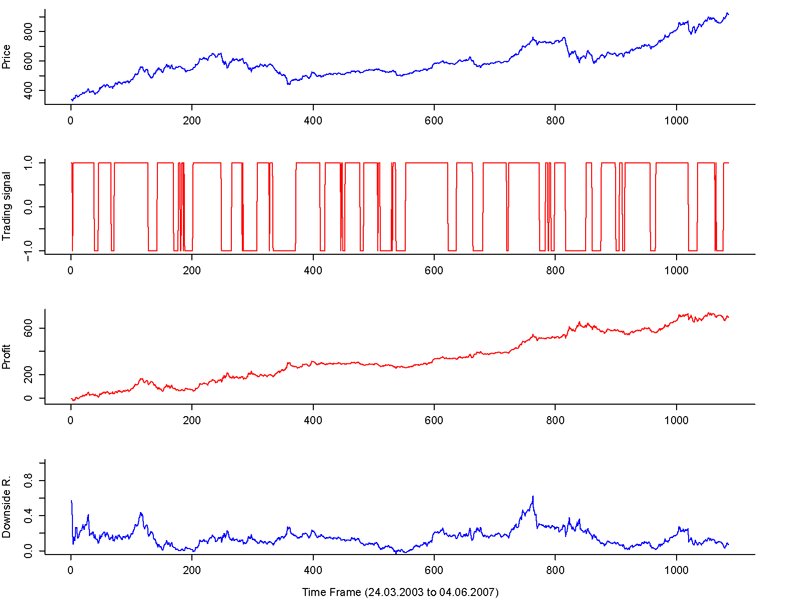
The next graphs were prepared with the saved simulation details of the trading system and the R-project software. They show the development of a long-short agent trading on the TecDAX during the period from 24.03.2003 to 04.06.2006. The differential downside deviation ratio was used as contribution to the optimization of the system parameters. The data series was taken from Yahoo!Finance (finance.yahoo.com) and the adjusted closed price was used for trading.
Multiple tests on various generations of artificial data showed some rational behavior of the agent, since decision changes and trading frequency were reduced by increasing the transaction costs. It does not wonder that also trading returns as well as the Sharpe ratio decreased.
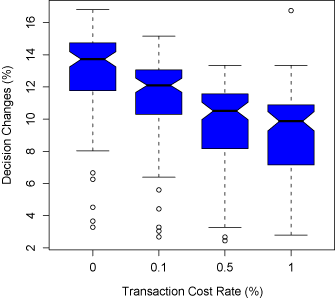
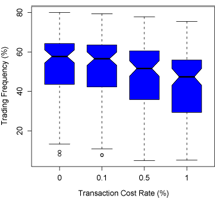
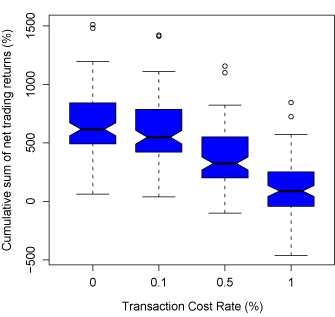
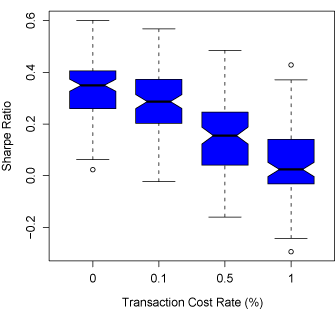
The boxplots above refer to simulations made on 100 different realizations of artificial price series with normal (Gauss) distributed noise in the price generation model.
The simulations were made on a machine with four 64-bit AMD